
Is It A Good Year to Start Investing?
When it comes to stock market performance, I think it’s natural for us as investors to want to chase high returns in the hopes of experiencing that outperformance within our portfolios or to somehow isolate ourselves from the overall shaky experience of the markets at large.
Take this year, for example. Despite working in financial services my entire career, believe me when I say that the US Total Stock Market’s* year-to-date performance of -18.58% is tough to stomach. In the short term, I must remind myself to follow the same investment principles I teach to the families I serve.
I realize 2022 was packed with emotional current events that could’ve spanned an entire decade. From inflation’s impact on our basic spending to Russia’s invasion of Ukraine to the Supreme Court overturning Roe v. Wade.
HERE’S AN IMPORTANT REMINDER ABOUT THE STOCK MARKET VS. THE ECONOMY:
THEY’RE RELATED BUT NOT THE SAME.
I feel the effects of the economy RIGHT NOW. When I buy groceries or gasoline, pay the monthly daycare bill, or see family and friends suffer layoffs.
But my investments in the stock market, spread across thousands of individual companies, represent ownership and an expectation of FUTURE value.
Behaviorally, this understanding is important when sticking to a long-term investment plan.
Even with a solid plan, staying disciplined when markets are jolting up and down in the short term is challenging. As the new year approaches, I want to help ease your fears and keep encouraging a long-term perspective on investing.
Let’s consider the historical context of US Total Stock Market returns with a review of years that have special meaning to me:
1956: THE YEAR MY DAD IS BORN
Federal-Aid Highway Act signed into law for the construction of 41K miles of interstate highways
Suez Crisis caused by the Egyptian Nationalization of the Suez Canal
Alabama Bus segregation laws declared illegal by US Supreme Court
8.3% US Total Stock Market Return
1960: THE YEAR MY MOM IS BORN
OPEC (Organization of Petroleum Exporting Countries) is formed
US announces 3,500 American soldiers are going to be sent to Vietnam
President Eisenhower signs the Civil Rights Act of 1960 into law
1.2% US Total Stock Market Return
1988: THE YEAR MY HUSBAND & I ARE BORN
Soviet Union withdraws its troops from Afghanistan
NASA’s Space Shuttle program resumes launches following 1986 Challenger disaster
Passenger aircraft brought down by terrorist bomb over Lockerbie, Scotland
18.0% US Total Stock Market Return
2007 - 2011: MY UNDERGRAD COLLEGE YEARS
Housing bubble bursts due to subprime mortgages and risky investments in mortgage-backed securities
Barack Obama elected the 44th President of the United States
Occupy Wall Street protests take place, condemning income inequality, the influence of money in politics, and a failing financial system
-36.7 US Total Stock Market Return (2008)
2016: THE YEAR I BECOME A MOM
Donald Trump elected the 45th President of the United States
Brexit - the UK votes to leave the European Union
Mosquito-transmitted Zika virus outbreak
13.6% US Total Stock Market Return
2018: THE YEAR WE WELCOME BABY #2
Facebook breaches data protection laws in the Cambridge Analytica data mining scandal
North & South Korea agree to an official end to the Korean War
California suffers its most destructive fire season ever
-5.0% US Total Stock Market Return
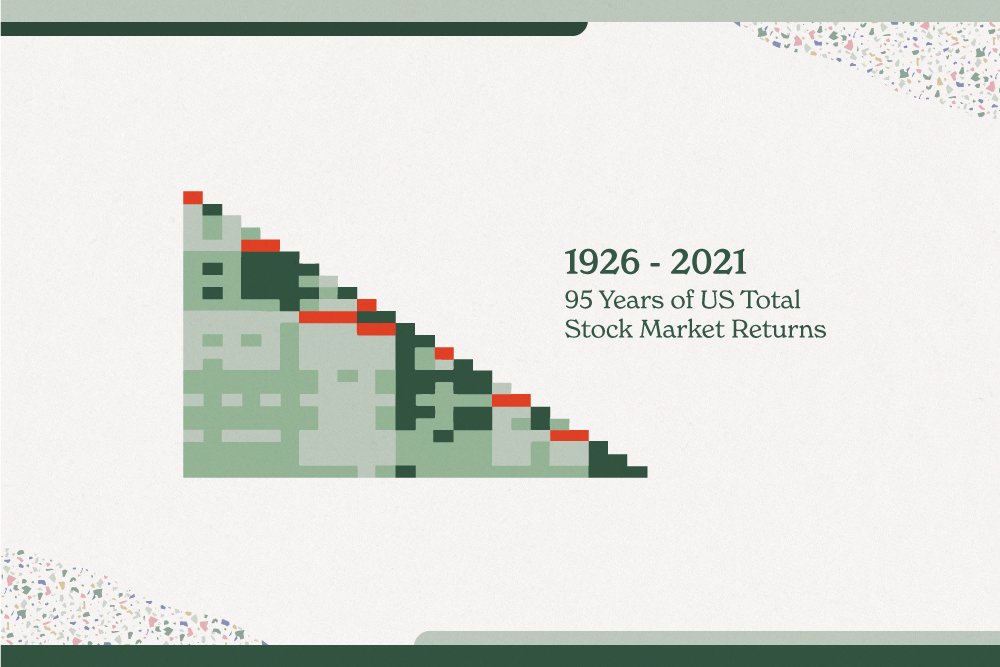
Despite the headlines, it’s tough to say which way the stock market will go in any given year. This volatility is something you see pretty consistently, especially within 1-5 year timeframes and even occasionally in 6-10 year timeframes. Take a look at the visual below for more context.

The heat map above symbolizes annualized returns of the stock market converted to shades of red and green. Shades of red represent years with negative returns and shades of green represent years with positive returns; the deeper the color, the more extreme the rate of return was for that given year.
The upper left hand corner column is the earliest year in the time period (1926). The bottom left hand cell represents the annual return for the 95 years from 1926 - 2021 (10.2%). As you travel down the diagonal you’re seeing yearly returns in the time period, and as you move down a column, you’ll see annualized returns for periods longer than one year.
Notice how the yearly returns show the deepest colors (highest highs and lowest lows). This is also where the red (negative returns) are concentrated too.
Consider if you traveled down each column 10-15 years, from any given column start date. Apart from some red years back in the Great Depression (upper left-hand corner), those 10-15 year ranges yield green positive annualized returns across the 1926-2021 time period.
Now consider the yearly returns along the diagonal. Jeff Troutner and the InteractFA team said it best:
“We often refer to the diagonal as the “barbed wire fence” of investing. If patient investors can understand and persevere through short-term periods in the market, they have the opportunity to enjoy the “green pastures” that US stocks have to offer over time.”
Let’s look back at the years I selected earlier. Below are the annualized returns dating back to each of these years as the starting date:
Returns Over the Entire Timeframe
1956 - 2021 (66 years): 10.7%
1960 - 2021 (62 years): 10.6%
1988 - 2021 (34 years): 11.6%
2008 - 2021 (14 years): 11.2%
2016 - 2021 (6 years): 17.5%
2018 - 2021 (4 years): 17.4%
The first four periods go back more than 10 years and show a consistent average annualized return of around 11%. The last two periods, the ages of my two children, are considered very short horizons for investing, where positive returns are more of a gamble. When I create an investment plan for clients, any money they need access to in the short term, especially in the next 1-3 years, stays in cash (typically within a high-yield savings account, earning a competitive interest rate).
2023: FOCUS ON WHAT YOU CAN CONTROL
Getting into the stock market at the right time or avoiding the next downturn may be tempting. In reality, we would be better served by focusing on what we can control:
Following an investment plan that aligns with our needs
Investing in well-diversified portfolios that are tax-efficient, control costs, and have low turnover
Staying disciplined through market dips and swings
Part of my process is to design and manage this alongside my clients. Investing is key to wealth creation, and expert guidance and management can lead to better long-term outcomes.
As you enter the new year, I’ll leave you with some wise words from Tom Gardner, co-founder of The Motley Fool: “The best time to start investing was yesterday. The next best time is today.”
If you’d like customized help using your financial resources effectively to make the most out of your wealth-building years, please schedule a free consultation here or email me with questions kelly@kkfp.co
Sign up for my monthly(ish) newsletter and get access to the free guide, “7 Questions Professional Women Should Ask Before Hiring a Financial Planner”. When you subscribe, I’ll also keep you up to date on KKFP’s blog posts, video content, educational webinars, and more.
*Source for market returns courtesy of Dimensional Fund Advisors Matrix Book 2022; US Total Stock Market represented by the CRSP 1-10 Index; CRSP Deciles 1-10 Index provided by the Center for Research in Security Prices, University of Chicago; July 1962 - Present: CRSP Deciles 1-10 Cap-based (market) Portfolio, rebalanced quarterly all exchanges, CRSP market index-weighted average of CRSP 1 through CRSP 10; Prior to July 1962: NYSE, rebalanced semiannually. Dimensional Fund Advisors LP is an investment advisor registered with the Securities and Exchange Commission. Dimensional Fund Advisors LP or its affiliates are not affiliated with Kelly Klingaman Financial Planning (KKFP); KKFP may offer Dimensional funds in their investment solutions.
Sources for historical events: ThePeoplesHistory.com; History.com; TheAtlantic.com; Investopedia.com; NPR.org; WHO.int
Disclaimer: This blog post is not intended to be a substitute for specific financial, tax or legal advice. The article is for general informational purposes only. Reproduction of this material is not permitted without written permission.